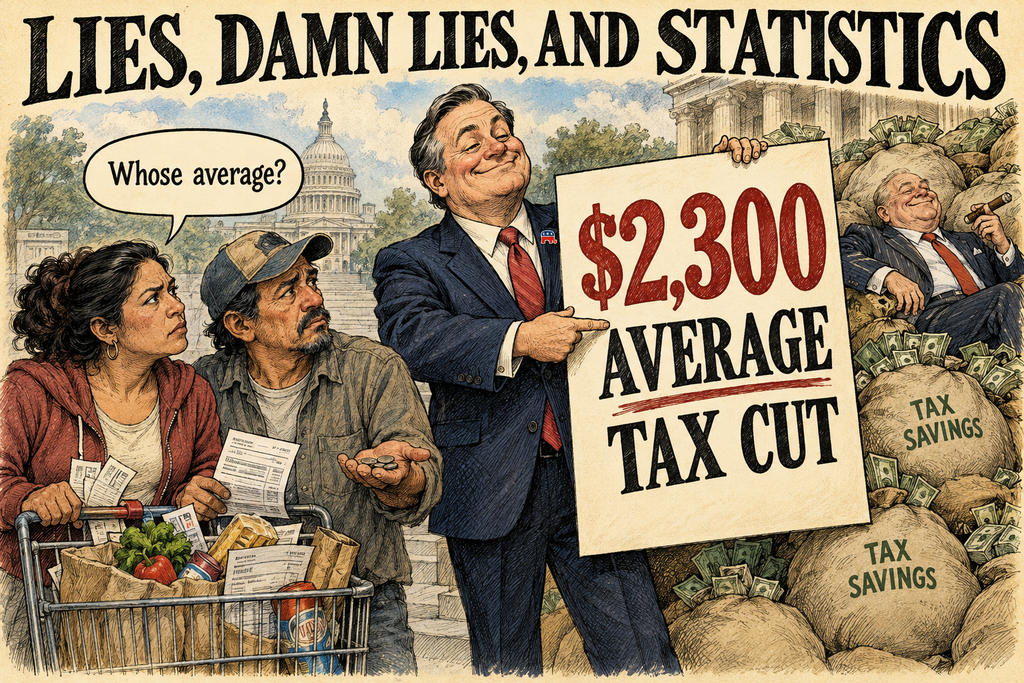
I recently read an article there, and I told myself they are playing with statistics. There are lies, damn lies, and statistics. When an article gives numbers that suggest people will get more, it deserves to be exposed.
A $2,300 Average Tax Cut—For Whom?
The New York Times recently reported that the Tax Foundation estimated a nearly $2,300 average tax cut in 2026 under the “Big Beautiful Bill.” A reader could easily take that number as a guide to what an ordinary taxpayer will receive. Before celebrating, however, we should ask whose savings went into that average.
The word “average” does considerable work here. Add up the estimated tax reductions and divide by the number of filers, and you have a mean. Large reductions for wealthy taxpayers can pull that number upward even when many other people receive much less.
Consider three households earning $80,000, $80,000, and $200,000. Their average income is $120,000, although two of the three earn $80,000. Their median—the middle income—is $80,000. The arithmetic is correct in both cases, but the numbers tell different stories about the people involved.
The Dollars Behind the Average
The Tax Foundation’s actual estimate is $2,272 per filer from individual tax changes. That is a national mean, not a median tax saving or a promise that each taxpayer will receive that amount. The linked analysis does not provide a nationwide median tax saving. taxfoundation.org
A separate Tax Policy Center analysis of the enacted legislation makes the uneven distribution clearer. Its July 2025 estimates for the law’s broader tax provisions show these approximate average reductions in 2026:
| Annual income group | Average annual tax reduction | Monthly equivalent |
|---|---|---|
| Below about $35,000 | $150 | $12.50 |
| About $67,000–$119,000 | $1,800 | $150 |
| About $460,000–$1.1 million | $21,000 | $1,750 |
These are averages within income groups, not median savings or guaranteed refunds. The monthly amounts simply divide the annual estimates by twelve; they are not monthly payments. Income bands use the center’s expanded cash income measure, which is broader than wages alone. Tax Policy Center
The center also estimated that nearly 60 percent of the 2026 tax benefits would go to the highest-income fifth of households, those with incomes of about $217,000 or more. Its model and coverage differ from the Tax Foundation’s, so its figures should not be presented as a breakdown of the Foundation’s $2,272 estimate. They provide another view of who benefits. Tax Policy Center
A Tax Cut Compared With What?
There is another distinction readers need. The Tax Foundation compares the legislation with the taxes people would have paid if the earlier Trump tax provisions expired as scheduled. Keeping an existing tax break therefore counts as a reduction against that projected increase. It does not necessarily mean a taxpayer pays $2,300 less than the previous year. taxfoundation.org
Families experience their finances when they fill their vehicles, buy groceries, and check what remains in the bank after the bills are paid. For the lowest-income group in the Tax Policy Center’s analysis, the average annual tax benefit works out to $12.50 a month. For the much wealthier group shown above, it works out to $1,750.
The quoted Times passage gives readers the national average without that distribution. Reporting the average is mathematically legitimate, but explaining who receives the money makes the report useful. Readers deserve enough information to locate their own circumstances within the estimate.
Before an average tax cut becomes a campaign selling point, the people hearing it should know how that average was calculated, what it was compared with, and how the benefits are divided. A family cannot pay its bills with someone else’s tax savings.