Before You Grade Latino Voters, Show Your Work
Opinion | November 7, 2026
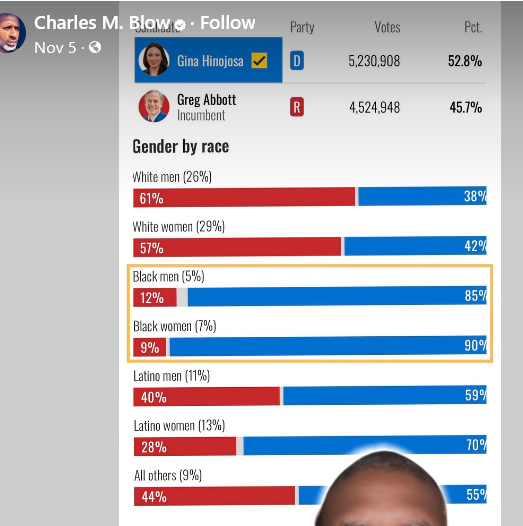
I kept running into a chart bragging that Black male voters were more supportive of Gina Hinojosa than Latino males. The chart is misleading, as the percentage of Blacks who identify as Democrats is much higher than the percentage of Hispanics who identify as Democrats. Black Republicans probably did not vote for Hinojosa.
Before anyone turns Texas election numbers into a report card on Latino loyalty, I want to see the questions behind the percentages. A difference between racial groups may be real while the explanation remains unsettled. Reporting the percentages is one thing; deciding what they say about an entire community requires more work.
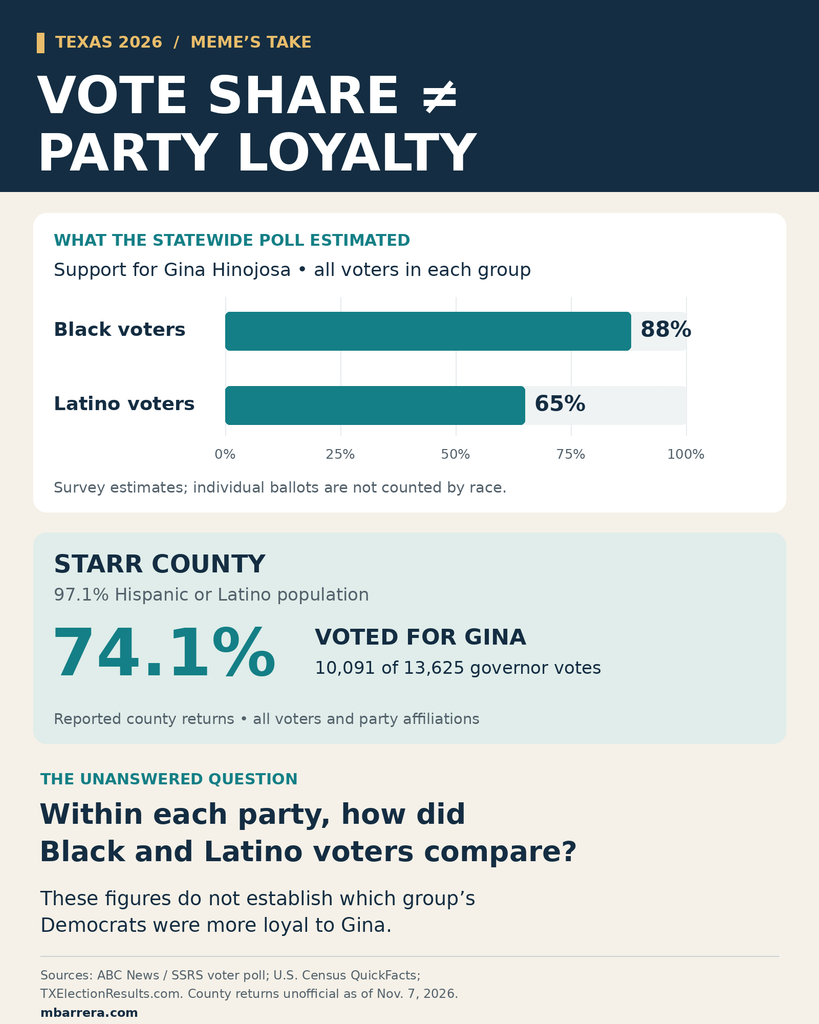
The figures circulating online come from a survey. ABC’s Texas governor voter poll estimates that Gina Hinojosa received 88% of Black voters’ support and 65% of Latino voters’ support. Among men, the estimates were 85% and 59%, respectively. Those are estimates of voting within each group, not a direct count of individual ballots by race.
Party affiliation is a question that comparison leaves unanswered. If one group contains a larger proportion of people who already identify as Democrats, that could help explain its higher Democratic vote share. To compare Democratic loyalty, we would need to examine Black Democrats and Latino Democrats within the same survey, with equivalent comparisons for independents and Republicans. The racial percentages alone do not provide that answer.
A separate Texas Southern University survey illustrates why that question matters. Its August report on Black Texas voters found that 82% identified as Democrats. That poll surveyed 500 Black Texans who had voted in at least one recent election and reported a margin of error of approximately 4.4 percentage points. Because it involved a different sample at a different time, we cannot combine its 82% with the election survey’s 88% to calculate crossover voting or prove what caused the racial gap.
Starr County offers some concrete election results worth including in the conversation. The Census Bureau’s QuickFacts puts its Hispanic or Latino population at 97.1%. In the reported November results, Hinojosa received 10,091 of the 13,625 votes recorded for governor, or 74.1%. Those returns demonstrate strong support in an overwhelmingly Hispanic county, although they do not identify each voter’s ethnicity, sex, or party affiliation.
Even two percentages from the same county can conceal a useful distinction. James Talarico received 10,072 votes in Starr County, 19 fewer than Hinojosa, yet his share was approximately 77%. His race had 13,082 valid votes reported, compared with 13,625 for governor. His percentage was higher because the total used to calculate it was smaller. Whether particular voters skipped a contest or changed parties between races requires additional evidence.
Seeing the same racial estimates in several publications does not necessarily provide independent confirmation. The Associated Press explains that it shares the SSRS Voter Poll with ABC, CBS, CNN, Fox, MSNOW and NBC. Multiple outlets can therefore be repeating findings from one survey. That survey can supply useful evidence, but repetition does not turn estimates into a census of every voter’s choices.
The researchers themselves acknowledge uncertainty. The published methodology says subgroup results have larger margins of error than statewide results. ABC’s race-by-gender table lists 5,138 respondents altogether, not 5,138 Black men and another 5,138 Latino men. Smaller groups require more care than a pair of confident-looking percentages might suggest.
My objection is to the conclusion readers may be encouraged to draw. The evidence we have does not establish that Latino Democrats were less supportive of Hinojosa than Black Democrats. Party identification may help explain the overall difference, but these figures do not establish how much. Starr County adds evidence of strong Hispanic-community support without settling that statewide question.
A calculator can divide whatever numbers we feed it. It cannot decide whether we selected the right groups to compare. Before someone hands an entire community a political report card, show the work.
County figures are reported unofficial returns checked November 7, 2026. Percentages calculated from the candidate totals include all reported valid votes in each contest; they are not percentages of all ballots cast in the county.
| Party’s candidate | Governor votes | Senate votes | Difference |
|---|---|---|---|
| Democratic | 10,091 | 10,072 | −19 |
| Republican | 3,435 | 2,772 | −663 |
| Libertarian | 99 | 238 | +139 |